Web Vitals is a Google initiative to provide unified guidance for quality signals, which is essential for delivering an excellent user experience on the web.
Over the years, Google has provided many tools to measure and report on performance. Some developers are experts in using these tools, while others find it challenging to keep up with them and their rich metrics.
Website owners don’t have to be performance experts to understand the quality of experience their websites provide to users. The “Web Vitals” program aims to simplify the environment and help websites focus on the most important indicator, “Core Web Vitals.”
Core web vitals are a subset of the web vitals applicable to all web pages. They should be measured by all website owners and will appear in all Google tools. Each Core Web Vital represents a different aspect of the user experience that can be measured on a site and reflects user-centric key results’ expertise.
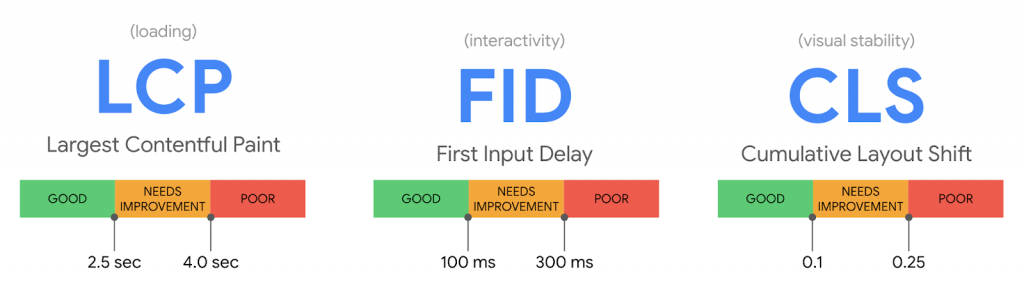
The indicators that make up the vitals of the core web will evolve over time. In 2020 three aspects of user experience were focused on:
This metric measures a web page’s loading performance by looking at the time it takes from the user requesting the URL to a site presenting the largest content element (or, more simply, the page’s loading speed for the user). To be considered “good,” LCP must occur within 2.5 seconds after the page first starts to load. Ranking between 2.5 and 4 seconds gets the page a “Needs Improvement” score, and everything starting from 4 seconds onward is marked as “Poor.”
Common problems that can cause LCP to slow down include third-party scripts and significantly large page elements such as images and videos.
FID measures a page’s interactivity. It takes account of the period starting from the user’s first interaction with the page (for example, clicking a link) to when the site processes the interaction. Any time below 100 milliseconds was rated as “good,” any time between 100 and 300 milliseconds was rated as “demands improvement,” and any time above 300 milliseconds was rated as “poor.”
One of the most common reasons for slow FID is the use of large JavaScript files on the page.
CLS measures the speed at which a web page becomes visually stable. Have you ever tried to click a link on a webpage, but the layout suddenly changed, so you accidentally clicked on other content? This is a shift in the layout and can be very frustrating for users.
A score of 0.1 equals “good”, 0.1-0.25 equals “needs improvement”, and 0.25 or higher equals “bad”.
The main reason for using CLS is to include images, ads, and iframes without predefined sizes and to use dynamically injected content.
Google announced that from June of this year they will include page experience signals in their search rankings. These signals measure how users perceive the experience of interacting with web pages and contribute to Google’s ongoing work to ensure people are getting the most useful and enjoyable experience possible on the web. We are already seeing a huge uptick in the number of users using Lighthouse and PageSpeed Insights to improve their websites, with a Google reporting a 70% increase in just the past few months. Many website owners are also already using Search Console’s Core Web Vitals report to identify opportunities for improvement.
The new page experience signal will combine Core Web Vitals with Google’s existing search signals, including mobile device friendliness, safe browsing, HTTPS security, and intrusive interstitial advertising guidelines.
Changes to non-AMP (accelerated mobile pages) content will also be rolled out in June 2021. This change will be eligible to appear in the Mobile Top Stories feature of Google Search. Any page that complies with the Google News content policy will be eligible. Google will give priority to pages with a good page experience. Whether it is implemented using AMP or any other web technology, Google will rank the results.
In addition to the timeline for the above-mentioned update, Google is also planning to test visual indicators to highlight pages in search results with a good page experience.

Because Google believes that providing information about the quality of a web page’s experience is key to helping users choose the best sites to visit, they are working on adding this information into their search result summaries. This will involve adding visual indicator details alongside the text or image previews for pages to provide users with additional context on the pages returned by their search results. If all goes well, Google could start sharing this enhanced level of information for web pages as early as June 2021.
To prepare for these changes, Google has released various tools that publishers can use to improve their page experience. As a first step publishers can conduct a site-wide review of their pages to see what needs improvement. The Search Console report for Core Web Vitals provides users with an overview of how their website performs and an in-depth understanding of the problem. Once the opportunity is identified, PageSpeed Insights and Lighthouse can help publishers solve all the problems found. You can go to web.dev/vitals-tools for a summary of all the tools needed to get started.
In addition, AMP is one of the easiest and most cost-effective ways for publishers seeking to deliver an excellent page experience to achieve their goal. According to analysis from the Google AMP team, most AMP pages can deliver an excellent page experience. AMP publishers should check out Google’s recently released AMP Page Experience Guide, a diagnostic tool that provides developers with actionable advice.
The recently announced Web Vitals program provides unified guidance on quality signals, which is essential for all sites to deliver an excellent user experience on the web. All of Google’s popular tools for web developers now support Core Web Vitals’ measurement to facilitate diagnosing and fixing user experience issues more easily. These tools include Lighthouse, PageSpeed Insights, Chrome DevTools, Search Console, Web.dev measurement tools, Web Vitals Chrome extension, and the new (!) Chrome UX Report API.
As Google Search uses Core Web Vitals as the basis for evaluating the page experience, these metrics must be as available and actionable as possible.
To start the journey of optimizing the user experience with Core Web Vitals, developers can try the following workflow:
Lighthouse is an automated website audit tool that can help developers diagnose problems and identify opportunities to improve their website’s user experience. It measures multiple dimensions of user experience quality in a laboratory environment, including performance and accessibility. The latest Lighthouse version (6.0, released in mid-May 2020) includes other reviews, new metrics, and a new composition of performance scores.
Lighthouse 6.0 introduced three new indicators to the report. Two of these new indicators-Maximum Content Painting (LCP) and Cumulative Layout Shift (CLS)-are the laboratory implementations of Core Web Vital, which provide important diagnostic information for optimizing the user experience. Considering their importance for evaluating user experience, the new indicators will be measured and included in the report. But they will also be taken into account when calculating the performance score.
The third new indicator included in Lighthouse-Total Block Time (TBT)-is closely related to another core Web vitals indicator, the “First Input Delay (FID)” field indicator. Follow the recommendations provided in the Lighthouse report and optimize based on the scores to give the users the best experience.
All of Lighthouse’s powerful products have been updated to reflect the latest version, including Lighthouse CI, enabling you to easily evaluate your core Web Vitals before merging and deploying pull requests.
PageSpeed Insights (PSI) reports the laboratory and field performance of pages on mobile and desktop devices. This tool outlines how users experience pages in the real world (powered by the Chrome UX report) and provides a series of actionable suggestions on how website owners can improve the page experience (provided by Lighthouse).
PageSpeed Insights and PageSpeed Insights API have also been upgraded to enable Lighthouse 6.0 to be used in the background. Now it supports measuring the core Web Vital in the laboratory and field parts of the report! As shown below, Core Web Vitals is annotated with a blue ribbon.
Search Console provides website owners with an excellent overview of page groups that need attention. At the same time, PSI helps identify opportunities for each page to improve the page experience. In the PSI, you can see whether your page has reached the threshold of a good experience for all Core Web Vitals at the top of the report, expressed as passing or failing the Core Web Vitals assessment.
The Chrome UX Report (CrUX) is a public dataset of real user experience data on millions of websites. It measures live versions of all core Web Vitals. Unlike laboratory data, CrUX data comes from selected users on site. Using this data, developers can understand the distribution of real-world user experiences on their own or even competitors’ websites. Even if there is no RUM on your site, CrUX can provide a quick and easy way to assess your core web vitals cycle. The CrUX dataset on BigQuery contains all the fine-grained performance data of Core Web Vital. It is available in monthly snapshots at the original level.
The only way to truly understand your website’s effects on users is to evaluate its performance on the spot as those users load and interact with it. This type of measurement is often referred to as “actual user monitoring,” or RUM for short. Even if there is no RUM on your site, CrUX can provide a quick and easy way to assess your core web vitals cycle.
There is a new “Experience” section on the “Performance” panel of Chrome DevTools that can help you detect unexpected layout shifts. This helps to find and fix visual instability issues on the page, which can cause cumulative layout shifts.
Select a layout pan to view its details in the “Summary” tab. To visualize where it has shifted, hover your mouse over the “Move to” and “Move to” fields.
The total block time (TBT) indicator can be measured in laboratory tools. It is an excellent alternative to “first input delay.” TBT measures the total time between “First Content Paint (FCP)” and “Interaction Time” (TTI), during which the main thread is blocked for long enough to prevent input responses. To improve the performance of TBT in the laboratory should improve the FID in the field.
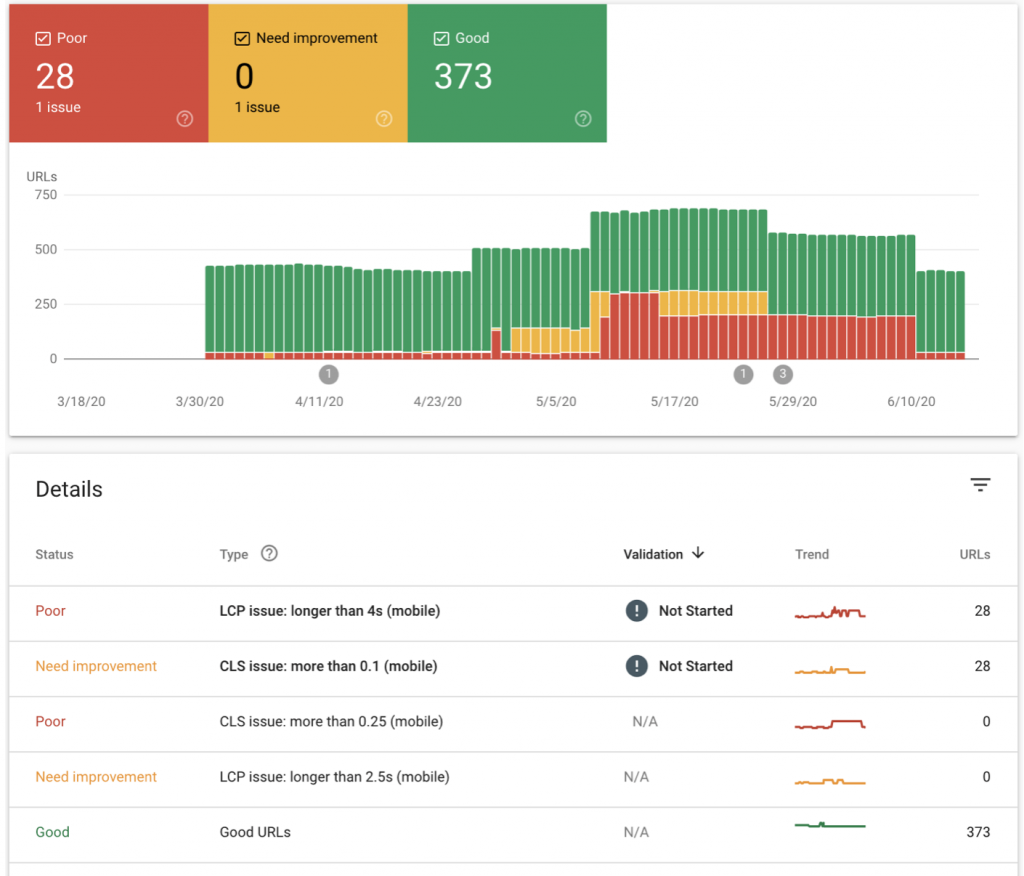
The new Core Web Vitals report in Search Console can help you determine the page groups that need attention on your website based on the real (live) data of CrUX. URL performance is grouped by state, metric type, and URL group (group of similar pages).
The report is based on three core Web Vitals indicators: LCP, FID, and CLS. If the URL does not have the minimum reported data for these metrics, it will be omitted from the report. Try the new report to get a complete picture of your source performance.
Once you have determined the type of page for Core Web Vitals-related issues, you can use PageSpeed Insights to understand specific optimization recommendations for representative pages.
The Web Vitals extension measures the three Core Web Vitals indicators of Google Chrome in real-time (desktop). This is very helpful for the early detection of problems in the development workflow and can be used as a diagnostic tool to evaluate Core Web Vitals’ performance when you browse the Web.
If you’re ready to take your digital marketing to the next level, it’s time to start working with our SEO team. We have expert knowledge of the latest developments in the world SEO and can keep your website ahead of the competitive curve. Contact us today to get started!
Don't be shy — say hello and we'll be glad to kickstart your next exciting digital marketing journey.